


Premium File
220 Q&A
$76.99$69.99
Splunk SPLK-1003 Exam Questions & Answers, Accurate & Verified By IT Experts
Instant Download, Free Fast Updates, 99.6% Pass Rate

SPLK-1003 Premium File: 220 Questions & Answers
Last Update: Jul 17, 2026
SPLK-1003 Training Course: 187 Video Lectures
SPLK-1003 PDF Study Guide: 519 Pages
$79.99
Splunk SPLK-1003 Exam Screenshots
Splunk SPLK-1003 Practice Test Questions in VCE Format
| File | Votes | Size | Date |
|---|---|---|---|
File Splunk.examlabs.SPLK-1003.v2026-05-21.by.ryan.82q.vce |
Votes 1 |
Size 3.33 MB |
Date May 21, 2026 |
File Splunk.certkey.SPLK-1003.v2021-12-01.by.evie.77q.vce |
Votes 1 |
Size 3.2 MB |
Date Dec 01, 2021 |
File Splunk.testking.SPLK-1003.v2021-07-19.by.liuwei.65q.vce |
Votes 1 |
Size 81.11 KB |
Date Jul 19, 2021 |
File Splunk.practicetest.SPLK-1003.v2021-04-27.by.charlie.54q.vce |
Votes 1 |
Size 70.91 KB |
Date Apr 28, 2021 |
File Splunk.passit4sure.SPLK-1003.v2020-08-20.by.phoebe.30q.vce |
Votes 2 |
Size 40.98 KB |
Date Aug 20, 2020 |
File Splunk.Braindumps.SPLK-1003.v2019-09-16.by.Sebastian.28q.vce |
Votes 4 |
Size 35.69 KB |
Date Sep 19, 2019 |
Splunk SPLK-1003 Practice Test Questions, Exam Dumps
Splunk SPLK-1003 (Splunk Enterprise Certified Admin) exam dumps vce, practice test questions, study guide & video training course to study and pass quickly and easily. Splunk SPLK-1003 Splunk Enterprise Certified Admin exam dumps & practice test questions and answers. You need avanset vce exam simulator in order to study the Splunk SPLK-1003 certification exam dumps & Splunk SPLK-1003 practice test questions in vce format.
The Splunk Enterprise Certified Administrator SPLK-1003 exam is a professional certification that validates an individual’s ability to manage, configure, and maintain a Splunk environment. Unlike many other IT exams that focus solely on theory, this exam emphasizes practical skills, requiring candidates to demonstrate real-world proficiency. It is designed for administrators who want to prove their capability in handling day-to-day Splunk operations, optimizing searches, managing data ingestion, and maintaining a secure and scalable Splunk deployment.
The exam covers several critical domains, including Splunk deployment and architecture, data onboarding and indexing, knowledge objects and search optimization, security and user management, and troubleshooting and maintenance. Understanding the structure and objectives of the exam is the first step in crafting an effective preparation strategy. Candidates who approach SPLK-1003 with both practical experience and theoretical understanding tend to achieve the best results.
A thorough grasp of Splunk’s architecture is essential for anyone preparing for the SPLK-1003 exam. Splunk environments typically include indexers, forwarders, and search heads, and understanding their interactions ensures that the system is efficient, scalable, and reliable.
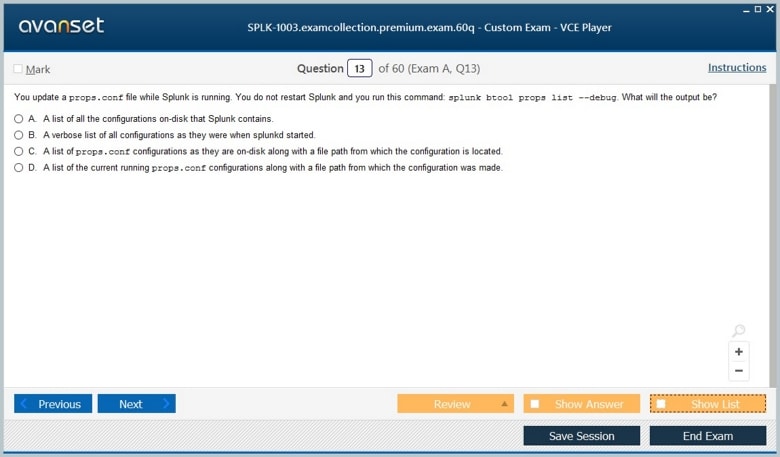
Indexers are the backbone of Splunk, responsible for receiving, parsing, and storing data for efficient search and analysis. Candidates should be familiar with configuring indexes, managing indexer clusters, and ensuring replication and search factor settings are properly implemented. Knowledge of indexer performance optimization, data retention policies, and indexing pipelines is also vital. Troubleshooting scenarios, such as slow searches due to indexer performance issues, are common in exam simulations, making practical experience with indexers invaluable.
Forwarders are lightweight or heavy agents installed on source systems to send data to indexers. Universal forwarders are commonly used for minimal system impact while collecting logs, whereas heavy forwarders can parse and route data before forwarding it. Candidates should understand how to configure forwarders, manage deployment apps, and troubleshoot forwarding issues, such as missing or duplicated data. Awareness of network considerations, like bandwidth optimization and secure data transfer, is also important.
Search heads enable users to query and analyze data stored in Splunk. A search head cluster allows for distributed searches, load balancing, and high availability. Candidates should understand how to configure search head clusters, manage knowledge objects across multiple instances, and optimize search performance. Understanding the interaction between search heads and indexers is critical, especially for distributed environments. Exam scenarios often include configuring distributed search setups or resolving search performance issues.
Effective Splunk deployment involves more than just installing components. Administrators must monitor system health, configure alerts, implement backup and disaster recovery strategies, and ensure scalability as data volume grows. High-availability configurations, replication settings, and clustering strategies are frequently tested in SPLK-1003. Practical experience in deploying Splunk in a lab environment helps reinforce theoretical knowledge, making it easier to tackle real-world problems during the exam.
Correctly onboarding and indexing data is central to Splunk administration. Candidates need to understand how to ingest various data types, normalize data for consistency, and configure inputs and source types efficiently.
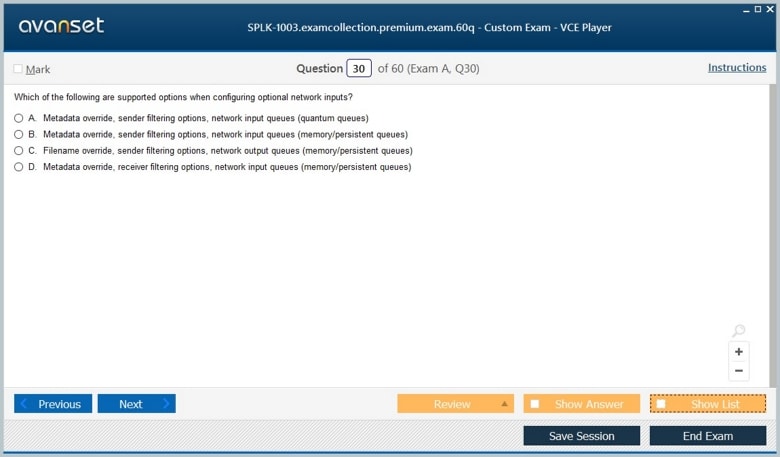
Splunk supports multiple data inputs, including files, directories, scripts, network ports, and APIs. Candidates should know how to configure data inputs, apply indexing settings, and manage forwarder inputs. Understanding data formats and the appropriate extraction methods ensures that data is correctly parsed and searchable.
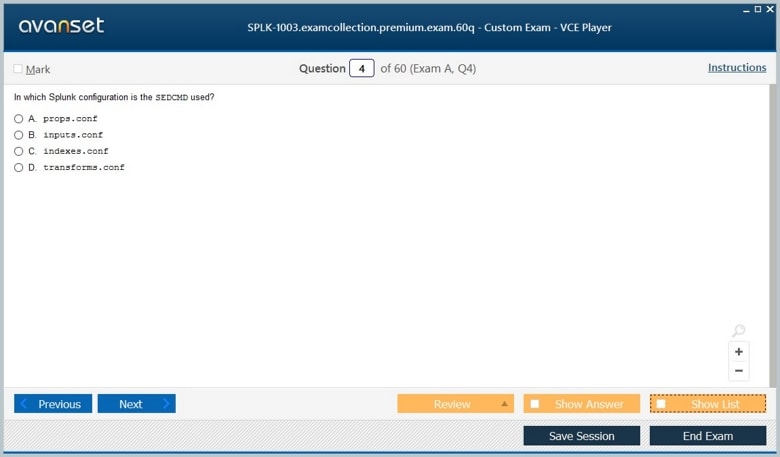
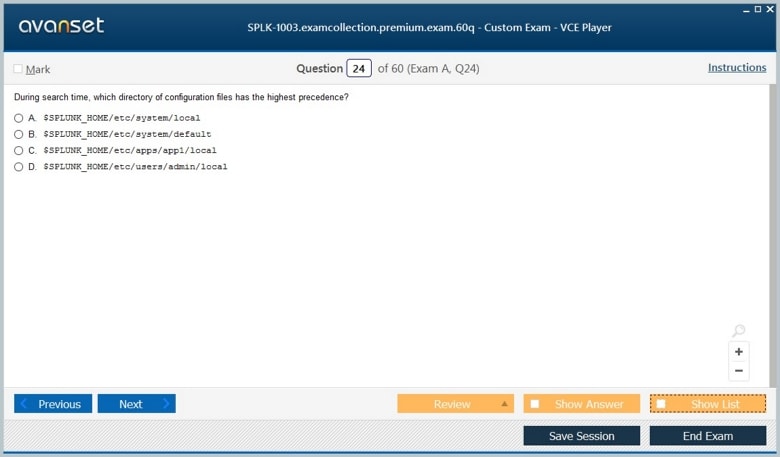
Source types define how Splunk interprets and parses incoming data. Candidates must be able to identify appropriate source types, configure props.conf and transforms.conf for field extractions, and apply regular expressions for custom field extraction. Accurate field extraction enables more precise searches and reporting, which is essential for both day-to-day administration and exam scenarios.
Indexes organize data for efficient storage and retrieval. Administrators must know how to create, manage, and monitor indexes, set retention policies, and configure indexer clustering. Understanding index volume management, bucket lifecycle, and frozen data handling is crucial for maintaining system performance and compliance.
Splunk provides several mechanisms to transform and enrich data during indexing. Candidates should be familiar with event breaking, timestamp recognition, character set encoding, and field aliasing. Properly configured data parsing ensures that searches return accurate results and enhances the value of dashboards and reports.
Knowledge objects are reusable entities in Splunk that enhance the usability and efficiency of searches. These include saved searches, event types, tags, lookups, and field extractions. Administrators must know how to create and manage these objects, apply best practices, and optimize their use for performance.
Saved searches allow repetitive queries to be reused and scheduled. Candidates should understand scheduling options, alert creation, and real-time versus historical search configurations. Practical experience with saved searches prepares candidates for scenarios involving system monitoring, incident response, and automation.
Event types categorize events based on specific criteria, enabling easier reporting and visualization. Tags further enhance this categorization, allowing multiple event types to be grouped. Understanding how to create, manage, and apply these objects is key for efficient search and reporting practices.
Lookups allow Splunk to enrich event data by referencing external datasets. Candidates must know how to configure CSV-based and automatic lookups, apply lookup transformations, and ensure data consistency. This skill is especially relevant for scenarios involving correlation searches, threat intelligence, and advanced analytics.
Search optimization is critical for system performance and faster results. Administrators should be familiar with strategies such as using summary indexing, search macros, accelerated data models, and optimized search strings. Knowing how to troubleshoot slow searches and tune search performance is often tested in practical exam simulations.
Splunk administrators are responsible for securing data and controlling user access. Understanding role-based access control, authentication methods, and audit capabilities is essential.
Creating and managing roles is central to controlling access to data and knowledge objects. Candidates should know how to define role capabilities, assign users, and apply inheritance to manage complex organizational structures. Exam questions may involve configuring access policies to ensure compliance and prevent unauthorized access.
Splunk supports multiple authentication methods, including LDAP, SAML, and native authentication. Candidates should be familiar with configuring these authentication sources, troubleshooting login issues, and implementing single sign-on for enterprise environments.
Monitoring user activity and auditing system access are vital for compliance. Administrators should know how to configure audit logging, generate reports on user activity, and apply security best practices to maintain system integrity.
Effective troubleshooting ensures a stable and reliable Splunk environment. Candidates should be adept at diagnosing and resolving common issues, monitoring system health, and performing routine maintenance tasks.
Monitoring involves tracking CPU, memory, disk usage, indexer performance, and search response times. Candidates must be able to use built-in dashboards, alerts, and logging mechanisms to proactively identify issues before they affect operations.
Common issues include data indexing errors, search failures, and performance degradation. Understanding log files, error messages, and Splunk internal commands is critical for quickly identifying root causes. Candidates should practice troubleshooting scenarios in a lab environment to build confidence.
Routine maintenance tasks include managing indexes, rolling data buckets, updating Splunk components, and performing backups. Proper maintenance prevents data loss, ensures high availability, and prolongs system performance. Exam scenarios often include applying maintenance procedures in distributed deployments.
Cracking the SPLK-1003 exam requires a balance of theory and hands-on experience. The following strategies help candidates prepare effectively:
Set up a lab environment to practice real-world scenarios, including deployment, indexing, and knowledge object management.
Use official study guides to structure preparation and ensure coverage of all exam objectives.
Practice search queries regularly to strengthen your understanding of Splunk’s search processing language.
Review common troubleshooting scenarios to develop problem-solving skills.
Take timed practice exams to improve time management and identify weak areas.
Engage with online communities and discussion forums to clarify doubts and learn tips from certified professionals.
Building on the foundational knowledge of Splunk administration, advancing to more complex tasks is crucial for managing enterprise-grade environments and preparing for the SPLK-1003 exam. This includes optimizing search performance, handling distributed deployments, integrating data from multiple sources, and fine-tuning Splunk for both security and operational efficiency.
Enterprise environments often require multiple Splunk components working together in a distributed architecture. Understanding this architecture is key for high availability, scalability, and efficient search performance.
Search head clustering allows multiple search heads to operate together, providing load balancing, failover, and centralized knowledge object management. Administrators should know how to configure clustering, replicate knowledge objects, and monitor the cluster's health. Key considerations include ensuring consistent search behavior across nodes and maintaining synchronization of user roles and scheduled searches.
Indexer clustering ensures data availability and reliability through replication. Candidates should understand search factors, replication factors, and the process for recovering from node failures. Maintaining indexer health, managing cluster master settings, and troubleshooting replication issues are commonly tested topics. Practical experience in setting up a test cluster reinforces understanding and builds confidence for exam scenarios.
In distributed environments, forwarders play a critical role in data ingestion. Administrators must be able to deploy universal and heavy forwarders at scale, manage deployment apps, and monitor forwarding health. Configuring outputs.conf, managing load balancing, and troubleshooting data loss issues are essential skills. Awareness of network bandwidth and latency impacts is also necessary.
Efficient data management extends beyond basic indexing. Splunk allows administrators to enrich and transform data, enabling deeper insights and more accurate reporting.
Lookups allow external datasets to augment event data. Candidates should know how to configure CSV lookups, automatic lookups, and external scripts for real-time enrichment. Understanding lookup priorities, resolving conflicts, and ensuring consistent data enrichment is important for both reporting and alerting.
Field aliases and calculated fields enhance search flexibility by standardizing field names or creating new fields based on calculations. Administrators should be comfortable defining these fields in props.conf and transforms.conf, testing their accuracy, and monitoring the impact on search performance. Practical experience ensures that these transformations are correctly applied in large datasets.
Event types and tags are vital for creating reusable classifications. Using advanced criteria and multiple field conditions allows better categorization and search efficiency. Candidates should practice creating complex event types and tags that simplify reporting and correlate multiple data sources.
Search optimization is a key differentiator between intermediate and advanced Splunk administrators. Slow searches can impact productivity and system performance, making this an important area for SPLK-1003 preparation.
Summary indexing allows large searches to be precomputed and stored for faster reporting. Candidates should understand how to configure summary indexing, schedule regular updates, and use the summarized data in dashboards or alerts. This technique is especially useful in high-volume environments where repeated searches can strain resources.
Data model acceleration improves search performance by precomputing portions of a dataset. Administrators should be familiar with creating, managing, and monitoring accelerated data models. Understanding when to use acceleration versus real-time searches ensures optimal use of system resources.
Search macros simplify complex search strings and improve efficiency. Candidates should practice creating macros, using them in scheduled searches, and understanding their impact on performance. Additional optimization techniques include limiting the use of wildcard searches, refining time ranges, and using indexed fields effectively.
As data volumes grow, protecting sensitive information and maintaining appropriate access controls is essential. Splunk administrators must implement robust security measures and manage user roles effectively.
Role-based access control (RBAC) allows administrators to define granular permissions. Candidates should know how to create roles with specific capabilities, assign users to roles, and manage inheritance. Exam scenarios often require configuring access to indexes, knowledge objects, and dashboards while ensuring compliance with organizational policies.
Splunk supports multiple authentication methods, including LDAP, SAML, and native Splunk authentication. Administrators should understand how to configure these methods, troubleshoot login issues, and integrate single sign-on for enterprise users. Real-world experience with authentication integration prepares candidates for complex exam scenarios.
Monitoring user activity is critical for security and compliance. Administrators should know how to enable audit logging, generate compliance reports, and monitor for unauthorized access or unusual activity. Using internal Splunk logs and dashboards to track administrative actions provides visibility and helps maintain accountability.
Efficient troubleshooting skills distinguish expert Splunk administrators from those who only understand the basics. Exam questions frequently simulate real-world problems requiring methodical diagnosis and resolution.
Indexing failures can result from misconfigured inputs, parsing errors, or connectivity issues. Candidates should be comfortable analyzing internal logs, verifying data paths, and identifying missing or malformed events. Understanding how to resolve bucket issues and correct timestamp errors ensures accurate search results.
Slow or incomplete searches can stem from high data volume, inefficient search strings, or resource constraints. Administrators must be able to identify performance bottlenecks, optimize searches, and configure system settings to improve responsiveness. Awareness of search concurrency, resource usage, and caching mechanisms is also important.
Distributed Splunk environments can encounter synchronization or replication issues. Candidates should know how to troubleshoot cluster master problems, search head inconsistencies, and forwarder misconfigurations. Practical exercises in a lab environment allow for better understanding of distributed behavior and failure recovery.
Maintaining a stable Splunk environment requires proactive maintenance and planning for upgrades. Candidates should understand best practices for patching, backing up configurations, and performing system upgrades with minimal downtime.
Regular tasks include rolling indexes, cleaning frozen buckets, monitoring system health, and validating backups. Administrators should develop checklists for routine maintenance to ensure consistent performance and data integrity.
Upgrading Splunk requires careful planning to prevent downtime and data loss. Administrators should know how to upgrade indexers, search heads, and forwarders in a coordinated manner. Knowledge of compatibility considerations, pre-upgrade testing, and rollback procedures is critical.
Monitoring system performance and planning for future growth ensures that Splunk environments scale effectively. Candidates should understand how to analyze resource utilization, forecast data growth, and implement strategies for horizontal or vertical scaling. Proper capacity planning minimizes performance issues and ensures reliability.
Preparation for the SPLK-1003 exam is not complete without consistent practice and strategic study approaches:
Maintain a dedicated lab environment for testing configurations, troubleshooting scenarios, and simulating distributed deployments.
Use official exam objectives to identify weak areas and structure study sessions around them.
Practice complex search queries and optimization techniques to build proficiency and speed.
Review case studies, troubleshooting guides, and community discussions to gain real-world insight.
Take timed practice tests to build exam endurance and improve decision-making under pressure.
Successfully passing the Splunk Enterprise Certified Administrator SPLK-1003 exam requires more than understanding theoretical concepts; it demands practical experience, strategic exam planning, and familiarity with real-world scenarios. This article provides guidance on applying Splunk knowledge effectively, managing exam time, and reinforcing skills through hands-on practice.
Before diving into preparation, candidates should clearly understand the SPLK-1003 exam objectives. These objectives guide study priorities and ensure that no critical area is overlooked. Core topics include:
Splunk deployment and architecture
Data onboarding and indexing
Knowledge objects and search optimization
Security and user management
Troubleshooting and maintenance
Familiarity with these domains allows candidates to anticipate the types of questions, practical tasks, and scenario-based problems they may encounter during the exam.
A well-organized study plan is crucial for effective exam preparation. Candidates should allocate time for both theory review and hands-on practice.
Determine how much time is available before the exam and divide it among the core domains. Prioritize areas where confidence is lower and ensure sufficient time is dedicated to practical exercises. Spreading study sessions over several weeks or months helps reinforce retention and reduces stress.
Setting up a lab environment is essential. Virtual machines or cloud-based instances can replicate enterprise deployments, allowing practice with forwarders, indexers, search heads, and clusters. Practical exercises should include data ingestion, field extraction, configuring alerts, and troubleshooting common issues. Real-world practice ensures candidates are comfortable navigating the Splunk interface and applying commands in realistic scenarios.
Splunk’s official documentation provides comprehensive guidance on configurations, commands, and best practices. Candidates should reference these resources frequently, especially for advanced topics like distributed deployments, clustering, and performance tuning. Understanding official recommendations ensures that solutions are aligned with industry standards.
The SPLK-1003 exam often presents scenarios that mimic challenges faced by Splunk administrators in enterprise environments. Practicing these scenarios improves problem-solving skills and readiness.
A common scenario involves managing a multi-node Splunk deployment with indexer and search head clusters. Candidates may need to troubleshoot data replication issues, search inconsistencies, or forwarder misconfigurations. Key skills include verifying cluster master settings, checking search head synchronization, and monitoring replication health. Practicing these tasks in a lab prepares candidates to resolve similar problems efficiently.
Administrators frequently encounter problems with missing or misformatted data. Candidates may be asked to configure inputs, adjust source types, or apply field extractions to ensure data is searchable. Skills such as configuring props.conf and transforms.conf, testing regular expressions, and validating indexed events are critical. Hands-on practice helps identify potential pitfalls and reinforces troubleshooting methods.
Exam scenarios often involve optimizing slow searches or scheduled reports. Candidates should know how to use summary indexing, accelerated data models, and search macros to improve performance. Understanding search concurrency, resource allocation, and caching mechanisms helps candidates design efficient search strategies in high-volume environments.
Another scenario may test access control and security configuration. Candidates could be asked to define roles, assign permissions, or configure authentication sources. Real-world experience with role-based access control, LDAP or SAML integration, and audit logging ensures readiness for these questions. Practicing user creation, role inheritance, and access restrictions reinforces best practices.
In addition to technical knowledge, strategic exam techniques are important for success.
Many exam questions are scenario-based and require careful reading. Identify key details, such as configuration requirements, constraints, or troubleshooting hints, before selecting an answer. Misinterpreting a scenario can lead to incorrect responses even if the candidate understands the underlying concepts.
Allocate time wisely during the exam. Some questions, particularly troubleshooting scenarios, require analysis and step-by-step reasoning. Track time spent on each question and avoid getting stuck on complex items. Moving on and returning later can prevent unnecessary time pressure.
For multiple-choice questions, eliminate obviously incorrect answers first. Narrowing down options increases the probability of selecting the correct choice and can help manage uncertainty. Cross-referencing your knowledge of best practices often provides clues to the correct answer.
Taking practice exams simulates the actual testing environment, allowing candidates to familiarize themselves with question formats, timing, and difficulty levels. Mock exams also highlight areas where further review or hands-on practice is needed. Repeated exposure builds confidence and reduces exam anxiety.
After practice exams, review all incorrect or uncertain answers. Understand why certain options were incorrect and how the correct answer aligns with Splunk best practices. Revision helps reinforce knowledge and prevents repeating mistakes on the actual exam.
Splunk has a vibrant community of users, administrators, and certified professionals. Engaging with forums, discussion groups, and knowledge bases provides access to tips, troubleshooting techniques, and practical insights that complement official study materials.
Participating in forums allows candidates to ask questions, share experiences, and learn from real-world scenarios. Many communities provide step-by-step guides, configuration examples, and explanations that clarify complex topics.
Webinars and video tutorials often cover practical demonstrations, including advanced configurations, performance tuning, and troubleshooting. Observing these real-world examples helps candidates visualize solutions and replicate them in their lab environments.
Studying with peers or mentors allows sharing of insights and collaborative problem-solving. Discussing challenging scenarios, explaining concepts to others, and practicing configurations collectively enhances understanding and retention.
As the exam date approaches, candidates should focus on reinforcing strengths and addressing remaining weaknesses.
Ensure all exam domains have been thoroughly reviewed, including deployment, indexing, knowledge objects, security, and troubleshooting. Use checklists to confirm coverage of every topic.
Perform final hands-on exercises, simulating real-world scenarios similar to those described in the exam objectives. Verify configurations, test searches, and troubleshoot common issues to build confidence.
Adequate rest, a balanced diet, and a calm mindset contribute to optimal performance. Avoid last-minute cramming; instead, focus on reviewing key concepts and maintaining clarity of thought.
Arrive early, ensure a quiet and comfortable environment, and approach each question methodically. Trust in your preparation, rely on your practical experience, and manage your time carefully to maximize accuracy and efficiency.
Passing the SPLK-1003 exam requires a combination of theoretical understanding, practical experience, and strategic exam techniques. By familiarizing yourself with real-world scenarios, optimizing search performance, managing distributed deployments, and mastering troubleshooting, candidates position themselves for success. Consistent hands-on practice, engagement with the community, and careful preparation ensure not only exam success but also readiness to excel as a Splunk Enterprise Certified Administrator in professional environments.
Go to testing centre with ease on our mind when you use Splunk SPLK-1003 vce exam dumps, practice test questions and answers. Splunk SPLK-1003 Splunk Enterprise Certified Admin certification practice test questions and answers, study guide, exam dumps and video training course in vce format to help you study with ease. Prepare with confidence and study using Splunk SPLK-1003 exam dumps & practice test questions and answers vce from ExamCollection.
Purchase Individually


Splunk SPLK-1003 Video Course

Top Splunk Certifications


Top Splunk Certification Exams
Site Search:

SPECIAL OFFER: GET 10% OFF

Pass your Exam with ExamCollection's PREMIUM files!
SPECIAL OFFER: GET 10% OFF
Use Discount Code:
MIN10OFF
A confirmation link was sent to your e-mail.
Please check your mailbox for a message from support@examcollection.com and follow the directions.

Download Free Demo of VCE Exam Simulator
Experience Avanset VCE Exam Simulator for yourself.
Simply submit your e-mail address below to get started with our interactive software demo of your free trial.
Just to let you guys know, the questions and answers for SPLK-1003 exam are still valid. they helped me ace my exam today! I love this site
@Zachary_D, this SPLK-1003 vce file is generally good and will help you pass. but also this is my advice, do not rely on this material only. use videos, books and even take courses… cover as much as you can. and then exam dumps will be a great tool to use to assess how you’ve grasped all that info. wish you the best!
Hello! Are there any setbacks in using this braindump for SPLK-1003 exam? sharing is caring
this SPLK-1003 practice test is incredible! it helped me prepare for my exam fast and it was very effective! I passed the test with no struggle!! am so happy
@micah, I can verify that this dump for SPLK-1003 exam is up to date. after using it I didn’t meet any strange questions in the exam. they helped me pass! this material is safe for you to use
hi, I am going to take this exam and would like to know whether SPLK-1003 exam dump is still valid. thanks in advance
Want to pass this exam