

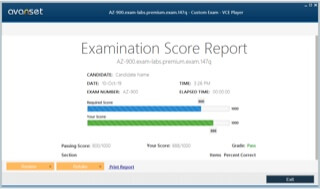

Premium File
148 Q&A
$76.99$69.99
CompTIA DA0-002 Exam Questions & Answers, Accurate & Verified By IT Experts
Instant Download, Free Fast Updates, 99.6% Pass Rate

DA0-002 Premium File: 148 Questions & Answers
Last Update: Oct 09, 2026
DA0-002 PDF Study Guide: 299 Pages
$74.99
CompTIA DA0-002 Practice Test Questions in VCE Format
| File | Votes | Size | Date |
|---|---|---|---|
File CompTIA.questionpaper.DA0-002.v2026-09-27.by.luke.7q.vce |
Votes 1 |
Size 116.52 KB |
Date Sep 27, 2026 |
CompTIA DA0-002 Practice Test Questions, Exam Dumps
CompTIA DA0-002 (CompTIA Data+) exam dumps vce, practice test questions, study guide & video training course to study and pass quickly and easily. CompTIA DA0-002 CompTIA Data+ exam dumps & practice test questions and answers. You need avanset vce exam simulator in order to study the CompTIA DA0-002 certification exam dumps & CompTIA DA0-002 practice test questions in vce format.
CompTIA Data+ DA0-002 is the current V2 exam for CompTIA’s vendor-neutral data analytics credential. It replaces the older DA0-001 version and reflects a broader analytics environment in which data work spans databases, cloud platforms, preparation pipelines, statistics, visualization, governance, and increasingly automated workflows.
The published blueprint contains five domains: Data Concepts and Environments at 20 percent, Data Acquisition and Preparation at 22 percent, Data Analysis at 24 percent, Visualization and Reporting at 20 percent, and Data Governance at 14 percent. CompTIA describes a maximum of 90 multiple-choice and performance-based questions in 90 minutes and recommends prior exposure to databases, analytical tools, statistics, and visualization.
Data+ is not a programming contest and it is not a pure statistics exam. The central skill is turning a business question into trustworthy data work: obtain the right data, prepare it correctly, analyze it with suitable methods, present the result clearly, and maintain quality and governance throughout the process.
The Data Concepts and Environments domain asks candidates to understand data types, structures, schemas, repositories, processing approaches, and the environments in which analytics work happens. Structured transactional data behaves differently from documents, logs, images, or streaming events.
Relational and NoSQL data models are useful to compare because storage design affects query patterns, consistency, scalability, and how data must be prepared for analysis. A warehouse optimized for reporting solves a different problem from an operational key-value store.
Practice identifying the natural grain of a dataset. What does one row or record represent? Which fields are dimensions, measures, identifiers, categories, timestamps, or free text? Many analysis errors begin before a formula is written because the analyst misunderstood what the data actually represents.
Data Acquisition and Preparation accounts for 22 percent. Analysts may receive data from databases, files, APIs, applications, web sources, cloud storage, or third-party feeds. The immediate technical task is access, but the analytical task is understanding origin, refresh behavior, ownership, and quality.
A dataset should have provenance: where it came from, when it was extracted, what filters were applied, which time zone or units it uses, what business process generated it, and whether the source can change retrospectively. Without that context, two accurate extracts can disagree and neither analyst will know why.
Preparation should be reproducible. Record transformations, joins, filters, type conversions, deduplication, and derived fields. If the same report cannot be rebuilt next week from the same source logic, the process is fragile.
Real datasets contain missing values, duplicates, inconsistent categories, impossible dates, stale records, mismatched units, outliers, and broken relationships. Cleaning is not simply deleting anything unusual; an outlier can be the most important observation in the dataset.
Data-quality controls help connect completeness, validity, consistency, uniqueness, timeliness, and accuracy with operational checks. A field can be syntactically valid and still be wrong for the business process it represents.
Practice writing validation rules before analyzing. Define allowed ranges, expected null behavior, unique keys, referential relationships, and freshness thresholds. Then count exceptions and decide whether they should be corrected, excluded, or explicitly reported as uncertainty.
Data+ candidates should be comfortable with query logic even if the exam is not a database-administrator certification. Filtering, sorting, aggregation, grouping, joins, calculated fields, and handling nulls are fundamental because they turn raw tables into analytical datasets.
Common SQL queries are useful practice when paired with reasoning. Before running a query, predict the row count and grain of the result. After a join, ask whether one-to-many relationships duplicated measures. After a filter, confirm whether null values were removed unintentionally.
Build a small relational dataset and answer business questions from it. Revenue by month, customers with repeat purchases, average resolution time by team, or products with declining volume are simple enough to understand and rich enough to expose grouping and join mistakes.
At 24 percent, Data Analysis is the largest V2 domain. Candidates need to work with descriptive statistics, distributions, relationships, trends, comparisons, segmentation, basic predictive concepts, and the interpretation of results.
The important skill is not memorizing formulas without context. Mean and median answer different questions when data is skewed. Correlation does not establish causation. A statistically significant difference may be operationally trivial. A model can fit historical data well and still fail when the underlying process changes.
Regression concepts provide one example of how assumptions, variables, fit, and interpretation interact. Practice explaining an analytical result in plain language and naming at least one limitation that could change the conclusion.
Visualization and Reporting represents 20 percent of DA0-002. Candidates should choose charts based on the relationship being shown: change over time, ranking, distribution, composition, correlation, or comparison. The design should reduce interpretation effort.
Business-intelligence reporting is useful context because dashboards combine data modeling, metrics, filters, refresh schedules, access control, and presentation. A visually polished dashboard can still be wrong if its measures have inconsistent definitions.
Practice simplifying charts. Remove decorations that do not encode information, label important values directly, use consistent scales, and state the business question the chart answers. If a reader has to decode the chart before seeing the pattern, the design is working against the analysis.
A report should make definitions, filters, dates, scope, and assumptions visible. If “active customer,” “revenue,” or “incident” can mean several things in the organization, the report must specify which definition was used.
Performance matters too. A dashboard that scans unnecessary data, executes inefficient queries, or recalculates expensive metrics for every user can become an operational problem. Analysts should understand how data model design, aggregation, caching, and refresh strategy affect usability.
Build reports with a validation page for yourself even if users never see it. Row counts, last refresh time, exception counts, source totals, and reconciliation metrics can reveal broken pipelines before a stakeholder makes a decision from bad data.
Data Governance accounts for 14 percent and covers ownership, access, privacy, security, quality, retention, standards, and responsible use. Governance is what keeps a dataset understandable and trustworthy after the original analyst leaves.
Governance controls are often discussed in cloud administration, but the underlying principles apply to analytics: define owners, classify data, restrict access, record lineage, manage retention, approve exceptions, and make changes traceable.
Least privilege is especially important in analytics because broad datasets can combine identifiers, financial information, behavior, and operational records. Analysts should receive the data required for the task rather than permanent access to every source “just in case.”
Create one project that moves from question to report. Start with a business problem, identify the source data, extract it, document provenance, clean and validate it, analyze it, build a visualization, write a conclusion, and record governance considerations. This produces more integrated skill than studying each objective in isolation.
Then deliberately introduce errors: duplicate keys, missing dates, inconsistent categories, an incorrect join, an outlier, a stale extract, or a mislabeled unit. Diagnose the effect on the result. Data professionals spend a large amount of time finding why numbers disagree, so failure analysis is valuable preparation.
The broader CompTIA certifications now includes increasingly specialized data and AI paths, but Data+ remains focused on practical analytics. DA0-002 readiness means you can move from raw data to a defensible insight while preserving quality, clarity, and governance at every step.
Performance-based analytics practice should also include reconciliation. Build two independent ways to calculate an important metric, such as revenue from transaction lines versus revenue from a summarized table, and investigate any difference. Reconciliation teaches analysts to distrust convenient numbers until source logic, joins, filters, and time boundaries agree.
Version two also makes cloud and automation context more relevant. Analysts increasingly work with scheduled pipelines, notebooks, APIs, managed warehouses, and automated reporting rather than one-off desktop files. You do not need to become a data engineer for Data+, but you should understand how refresh schedules, credentials, schema changes, and pipeline failures can alter a report without changing the visible dashboard layout.
Data ethics should be considered whenever an analysis can materially affect people. A technically accurate model or segmentation can still be misleading if the data underrepresents a population, encodes historical bias, or is presented without uncertainty. Data+ candidates should be able to identify where collection methods, sampling, missingness, and proxy variables can distort a conclusion.
Finally, practice requirements gathering with stakeholders. Ask what decision the analysis will support, which metric defines success, what time period matters, who owns the source, and how often the answer must refresh. Clear requirements reduce the risk of producing a precise answer to the wrong business question.
Keep a data dictionary for the practice project. Defining each field, unit, allowed value, source, owner, and business meaning is a simple exercise that exposes ambiguity before it reaches the dashboard.
Go to testing centre with ease on our mind when you use CompTIA DA0-002 vce exam dumps, practice test questions and answers. CompTIA DA0-002 CompTIA Data+ certification practice test questions and answers, study guide, exam dumps and video training course in vce format to help you study with ease. Prepare with confidence and study using CompTIA DA0-002 exam dumps & practice test questions and answers vce from ExamCollection.
Purchase Individually

Top CompTIA Certifications



Top CompTIA Certification Exams
Site Search:

SPECIAL OFFER: GET 10% OFF

Pass your Exam with ExamCollection's PREMIUM files!
SPECIAL OFFER: GET 10% OFF
Use Discount Code:
MIN10OFF
A confirmation link was sent to your e-mail.
Please check your mailbox for a message from support@examcollection.com and follow the directions.

Download Free Demo of VCE Exam Simulator
Experience Avanset VCE Exam Simulator for yourself.
Simply submit your e-mail address below to get started with our interactive software demo of your free trial.