Premium File
98 Q&A
$76.99$69.99
SAS Institute A00-240 Exam Questions & Answers, Accurate & Verified By IT Experts
Instant Download, Free Fast Updates, 99.6% Pass Rate

A00-240 Premium File: 98 Questions & Answers
Last Update: Nov 08, 2026
A00-240 Training Course: 87 Video Lectures
A00-240 PDF Study Guide: 895 Pages
$79.99
SAS Institute A00-240 Exam Screenshots
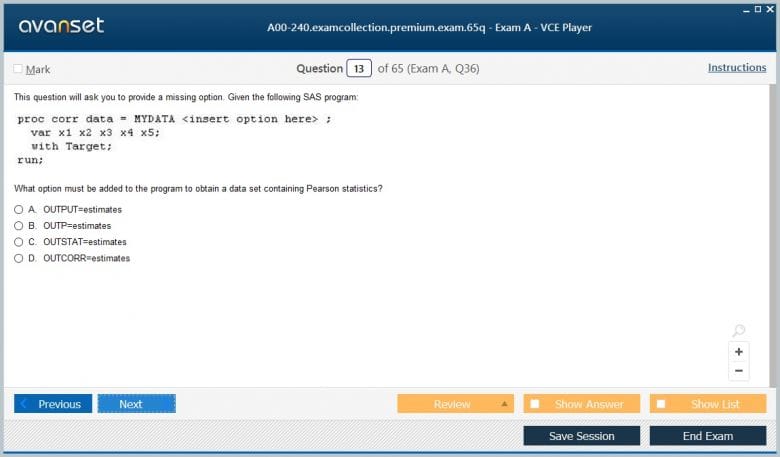
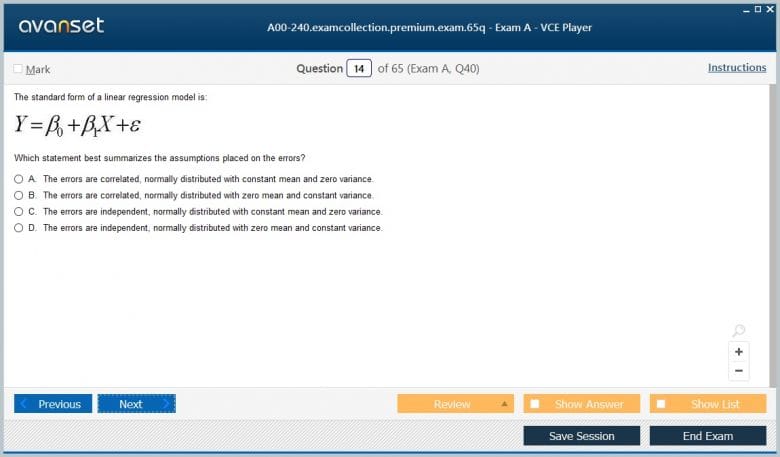
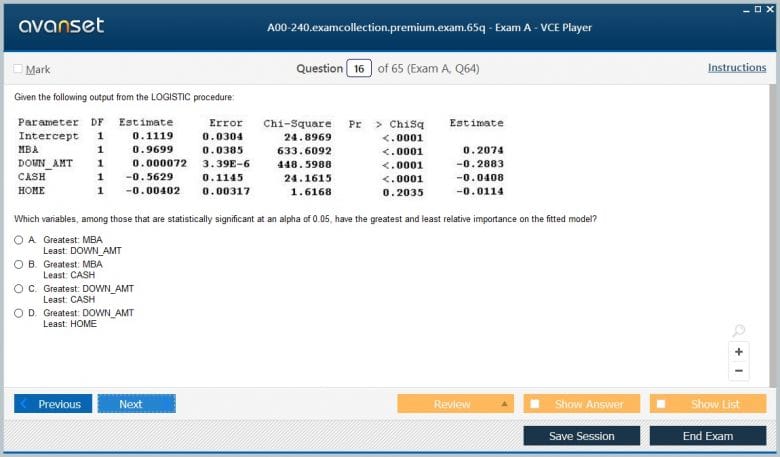
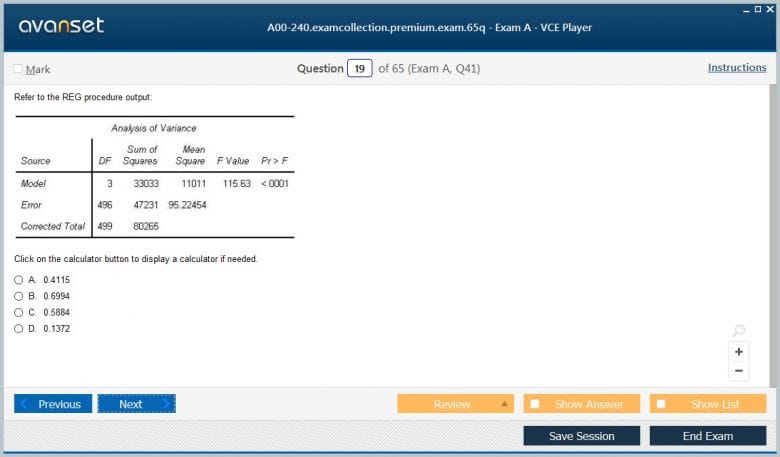
SAS Institute A00-240 Practice Test Questions in VCE Format
| File | Votes | Size | Date |
|---|---|---|---|
File SAS Institute.test-inside.A00-240.v2026-09-05.by.noah.54q.vce |
Votes 1 |
Size 2.27 MB |
Date Sep 04, 2026 |
File SAS Institute.certkey.A00-240.v2020-06-30.by.connor.60q.vce |
Votes 3 |
Size 1.7 MB |
Date Jun 30, 2020 |
SAS Institute A00-240 Practice Test Questions, Exam Dumps
SAS Institute A00-240 (SAS Statistical Business Analysis Using SAS 9: Regression and Modeling) exam dumps vce, practice test questions, study guide & video training course to study and pass quickly and easily. SAS Institute A00-240 SAS Statistical Business Analysis Using SAS 9: Regression and Modeling exam dumps & practice test questions and answers. You need avanset vce exam simulator in order to study the SAS Institute A00-240 certification exam dumps & SAS Institute A00-240 practice test questions in vce format.
A00-240 remains available as the SAS Statistical Business Analysis Using SAS 9: Regression and Modeling exam for the Statistical Business Analyst credential, but its status is now transitional. SAS has announced that the exam will retire on November 30, 2026; certifications earned before that retirement date will not expire, and SAS points candidates toward A00-480 Applied Statistics for Machine Learning as an alternative. Until retirement, A00-240 continues to emphasize analysis of variance, linear regression, logistic regression, preparing inputs for predictive models, and measuring model performance.
The exam is not simply about reading procedure syntax. Statistical business analysis requires turning a business question into a defensible model, checking assumptions, interpreting coefficients and diagnostics, comparing alternatives, and communicating what the model can and cannot support. The strongest candidates connect statistical output to the decision context.
Within SAS Institute certifications, A00-240 sits closer to applied statistical reasoning than programming-only credentials. Programming fluency helps prepare and validate data, but the core challenge is interpreting evidence. A useful conceptual companion is regression in machine learning, especially when distinguishing predictive association from causal claims.
A model is only meaningful when the observation represents the right business entity and the response matches the decision being studied. Customer-level, transaction-level, store-level, and monthly observations answer different questions. Mixing levels can create duplicated information, leakage, or misleading significance.
Write the modeling objective in one sentence before touching the data. Identify the target, observation unit, prediction horizon, and intended use. Then list variables that would not have been known at the prediction time. This simple discipline prevents data leakage and keeps model evaluation aligned with real deployment.
Analysis of variance evaluates whether group differences are larger than would be expected from within-group variability. Candidates should understand factors, levels, sums of squares, F tests, and the role of multiple comparisons. A significant overall test does not automatically identify which groups differ or whether the difference is practically important.
Use a business example with several marketing treatments or regions. Examine assumptions, run the overall comparison, and then interpret pairwise results with appropriate adjustment. Report the magnitude of differences alongside p-values so stakeholders understand whether the statistical finding is meaningful enough to change a decision.
Multiple linear regression estimates how the expected response changes with predictors while holding other included variables constant. Interpretation depends on coding, units, interactions, and transformations. Coefficients are not meaningful in isolation from the model specification and data range.
For each coefficient, state the comparison it represents. If an interaction is present, explain why a main effect can no longer be interpreted as a universal average. Translate model results into business units whenever possible, then check whether the magnitude is plausible and useful rather than focusing only on statistical significance.
Linear models rely on assumptions about the error structure and functional form. Residual plots can reveal nonlinearity, unequal variance, unusual observations, or patterns that suggest missing structure. Normality matters differently for estimation and inference, and large data sets can make trivial deviations look dramatic.
When a diagnostic is poor, connect the remedy to the problem. A transformation may stabilize variance, an interaction may address non-additive behavior, a nonlinear term may improve functional form, and an influential observation may require data verification. Do not automatically delete points merely because a diagnostic flags them.
Adding predictors can improve fit on the training data while weakening generalization, increasing instability, or making interpretation difficult. Automated selection procedures are tools, not substitutes for subject-matter judgment. Correlated predictors can also make individual coefficients unstable even when overall prediction remains adequate.
Start with a defensible candidate set and document why each variable is available and relevant. Compare nested models using appropriate criteria and validation, then review whether selected variables create operational or fairness concerns. A business model must be deployable and explainable enough for its intended use.
For binary outcomes, logistic regression models the log odds of an event. Coefficients are often interpreted through odds ratios, but the business audience may understand predicted probabilities more easily. Coding of the event level and reference categories is critical because reversing them changes the apparent direction of effects.
Take a churn or response model and calculate how predicted probability changes for representative cases. Explain the difference between an odds ratio and an absolute probability change. This prevents common communication errors in which a large-sounding odds ratio is presented without context about the baseline event rate.
A logistic model produces scores or probabilities; a threshold converts them into classifications. Sensitivity, specificity, false positives, false negatives, and predictive values change as the threshold moves. The best cutoff depends on the cost of different errors, not a universal rule such as 0.5.
For fraud review, missing a true case may be costly but investigating too many false alarms also consumes resources. Build a small cost table and compare thresholds. This connects model evaluation to the operating process and shows why classification performance must be interpreted in the context of available capacity and business consequences.
Training fit can overstate expected performance because the model has already adapted to those observations. Holdout validation, cross-validation, or other resampling strategies provide a more realistic estimate of generalization. The exact method depends on sample size, time structure, and whether observations are independent.
Avoid random splitting when the deployment problem is fundamentally temporal and future observations differ from the past. In that case, a time-based validation may be more realistic. The evaluation design should mimic how the model will encounter new data, otherwise a strong metric can give false confidence.
ROC curves and area under the curve summarize ranking performance across thresholds, while lift and gains help evaluate concentration of events in high-scoring groups. Misclassification rates depend on a chosen threshold. No single metric captures every operational concern, especially when event prevalence is low.
Select metrics based on the decision. If a campaign can contact only the top ten percent of customers, lift in that segment may matter more than overall accuracy. If a regulated decision requires calibrated probabilities, ranking alone is insufficient. Candidates should be able to explain why a metric is appropriate, not just read its value.
Missing values, outliers, skewed variables, rare categories, inconsistent coding, and leakage can have larger effects than the choice of statistical procedure. Transformations and derived variables should be based on a clear rationale and applied consistently to training and scoring data.
The boundary between analytics and engineering is visible in data science, big data, and data analytics roles. A business analyst may not own the entire pipeline, but must understand how source definitions and preparation choices affect the model. Reproducible preprocessing is part of statistical validity.
Confidence intervals, prediction uncertainty, sampling limitations, omitted variables, drift, and non-causal interpretation all matter when stakeholders use a model. A statistically significant predictor does not prove that changing it will cause the outcome to change. Models summarize relationships under assumptions and data conditions.
Write an executive summary that states the objective, strongest findings, validation performance, operational threshold, and key limitations. Avoid turning procedure output into a wall of numbers. The analyst adds value by translating statistical evidence into decisions while preserving uncertainty.
For candidates testing before retirement, SAS currently lists A00-240 with 60 scored multiple-choice and short-answer questions, plus up to five unscored items, a one-hour-and-50-minute testing window, and a 68 percent passing score. SAS also publishes objective weights across ANOVA, linear regression, logistic regression, data preparation, and model performance. The exam remains registerable now, but anyone planning beyond November 30, 2026 should use the A00-480 pathway rather than assuming A00-240 will remain available.
For every practice model, explain the output without looking at notes: what was tested, what the coefficient means, whether diagnostics are acceptable, how the model performs on validation data, and what decision it supports. Then reproduce the analysis in SAS. This combination builds both statistical reasoning and tool fluency.
Categorical predictors need careful reference-level interpretation. Indicator coding expresses effects relative to a chosen baseline, so changing the reference does not change the fitted information but does change the coefficients presented. Analysts should select reference categories that make the business comparison clear and state them explicitly when communicating results.
Interactions are especially important when the effect of one predictor depends on another. A promotion may work differently for existing and new customers, or a risk factor may vary by age group. When an interaction is included, interpret predictions or simple effects at meaningful combinations rather than reading the individual main-effect coefficients as universal statements.
Model monitoring should be considered even when the exam focuses on development and evaluation. Population characteristics, event rates, and predictor relationships can shift after deployment. Establishing a baseline for score distributions and performance metrics makes later drift visible. A model is a maintained decision asset, not a permanent mathematical truth.
Good analysts also separate statistical significance from business importance. With large samples, very small effects can produce tiny p-values. Compare confidence intervals and effect sizes with operational thresholds: a predictor can be real but too weak to justify a process change. This distinction is central to responsible interpretation of SAS model output.
Collinearity deserves attention because highly related predictors can make individual coefficient estimates unstable. The model may still predict reasonably well, but interpretation becomes fragile. Analysts should inspect relationships among predictors and avoid presenting unstable coefficients as precise independent effects when the data cannot support that claim.
Sampling design and representativeness also shape conclusions. If the modeling data excludes important customer groups or reflects a temporary campaign, validation within the same sample may still look strong. Before deployment, compare the modeling population with the population on which decisions will be made and document material differences.
Go to testing centre with ease on our mind when you use SAS Institute A00-240 vce exam dumps, practice test questions and answers. SAS Institute A00-240 SAS Statistical Business Analysis Using SAS 9: Regression and Modeling certification practice test questions and answers, study guide, exam dumps and video training course in vce format to help you study with ease. Prepare with confidence and study using SAS Institute A00-240 exam dumps & practice test questions and answers vce from ExamCollection.
Purchase Individually


SAS Institute A00-240 Video Course
Site Search:

SPECIAL OFFER: GET 10% OFF

Pass your Exam with ExamCollection's PREMIUM files!
SPECIAL OFFER: GET 10% OFF
Use Discount Code:
MIN10OFF
A confirmation link was sent to your e-mail.
Please check your mailbox for a message from support@examcollection.com and follow the directions.

Download Free Demo of VCE Exam Simulator
Experience Avanset VCE Exam Simulator for yourself.
Simply submit your e-mail address below to get started with our interactive software demo of your free trial.